Multiple comparisons
Prof. Maria Tackett
Topics
Next steps after ANOVA
Individual vs. family-wise Type I error
Multiple comparisons using Bonferroni correction
Aldrin in the Wolf River

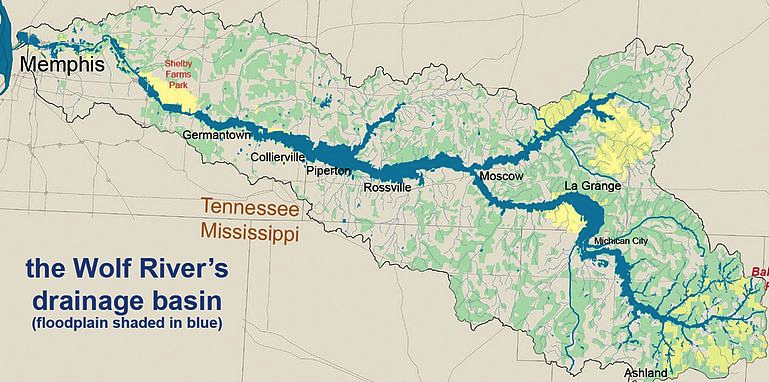
The Wolf River in Tennessee flows past an abandoned site once used by the pesticide industry for dumping wastes, including chlordane (pesticide), aldrin, and dieldrin (both insecticides).
These highly toxic organic compounds can cause various cancers and birth defects.
Aldrin in the Wolf River
- The standard methods to test whether these substances are present in a river is to take samples at six-tenths depth.
These compounds are denser than water and their molecules tend to stick to particles of sediment, they are more likely to be found in higher concentrations near the bottom than near mid-depth.
We will compare mean concentration levels (in nanograms per liter) for three depths.
Is there a difference between the mean aldrin concentrations among the three depth levels?
ANOVA
| term | df | sumsq | meansq | statistic | p.value |
|---|---|---|---|---|---|
| depth | 2 | 16.961 | 8.480 | 6.134 | 0.006 |
| Residuals | 27 | 37.329 | 1.383 |
H0:μ1=μ2=μ3Ha:At least one depth level has μi that is not equal to the others
ANOVA
| term | df | sumsq | meansq | statistic | p.value |
|---|---|---|---|---|---|
| depth | 2 | 16.961 | 8.480 | 6.134 | 0.006 |
| Residuals | 27 | 37.329 | 1.383 |
The p-value is very small (≈0), so we reject H0. The data provide sufficient evidence that at least one depth level has a mean aldrin concentration that differs from the others.
We know at least one depth level has a mean aldrin concentration that differs from the others.
The next question we want to answer in our analysis is which one?
Difference in means
We can use confident intervals to estimate the difference between the means, μi−μj for each pair of groups
(ˉyi−ˉyj)±t∗×√MSWithin(1ni+1nj)
where the critical value t∗ is calculated from a t distribution with n−K degrees of freedom.
Difference in means
We can use confident intervals to estimate the difference between the means, μi−μj for each pair of groups
(ˉyi−ˉyj)±t∗×√MSWithin(1ni+1nj)
where the critical value t∗ is calculated from a t distribution with n−K degrees of freedom.
If we have K groups, we will make (K2)=K(K−1)/2 such comparisons
Comparisions for Aldrin data set
There are 3 depth levels in our data, so we can make (32)=3(3−1)/2=3 comparisons
Comparisions for Aldrin data set
There are 3 depth levels in our data, so we can make (32)=3(3−1)/2=3 comparisons
(ˉymiddepth−ˉybottom)±t∗×√MSWithin(1nmiddepth+1nbottom)
(ˉysurface−ˉybottom)±t∗×√MSWithin(1nsurface+1nbottom)
Individual vs. Family-wise Type I Error
Type I error: Incorrectly reject H0.
- In our example, incorrectly reject the null hypothesis that mean aldrin concentration levels are equal
- Based on our confidence interval, we incorrectly conclude there is a difference in the mean aldrin concentration for the two groups
Individual Type I error: incorrectly reject H0 for one specific comparison of group means
Family-wise Type I error: Incorrectly reject H0 for at least one comparison of group means
Multiple Comparisons
The probability of making an individual Type I error is α=1−C, where C is the confidence level
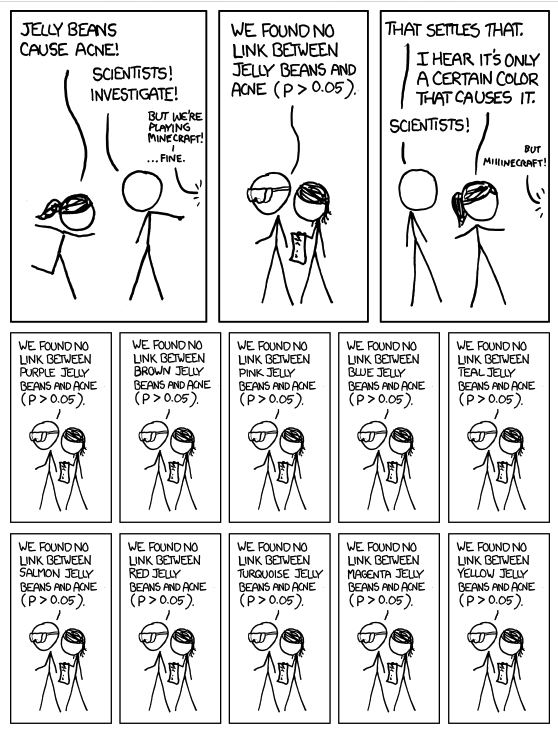
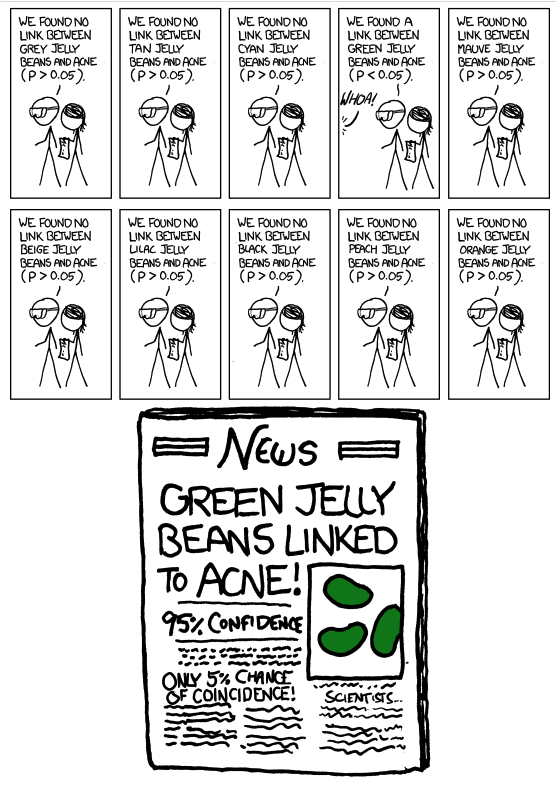
Even if the probability of making an individual Type I error is low, the probability of making a family-wise Type I error becomes much larger when we make multiple comparisons
xkcd "Significant"

Correcting for multiple comparisons
(ˉyi−ˉyj)±t∗√MSWithin(1ni+1nj)
where the critical value t∗ is calculated from a t distribution with n−K degrees of freedom.
When we make multiple comparisons, we will select the critical value t∗ to control for the probability of making a family-wise Type I error
Bonferroni correction
Goal: Choose the critical value t∗ such that the probability of making a family-wise Type I error is α.
To do so, we will choose t∗ such that the probability of making an individual Type I error is αm, where m is the number of comparisons
In other words, we will find t∗ that corresponds to a confidence level of 1−α/m.
Comparisons for the Aldrin data set
We want the probability of making a family-wise Type I error to be α=0.05.
Comparisons for the Aldrin data set
We want the probability of making a family-wise Type I error to be α=0.05.
We are making 3 comparisons. Therefore, we want probability of making an individual Type I error to be α/m=0.05/3.
Comparisons for the Aldrin data set
We want the probability of making a family-wise Type I error to be α=0.05.
We are making 3 comparisons. Therefore, we want probability of making an individual Type I error to be α/m=0.05/3.
We calculate each confidence interval using the critical value t∗ that corresponds to a confidence level of C=1−0.05/3≈0.9833 in the t distribution with 30−3=27 degrees of freedom.
Pairwise comparisions in R
library(pairwiseCI)pairwiseCI(aldrin ~ depth, data = aldrin, conf.level = 1- 0.05/3, var.equal = TRUE) %>% kable(digits = 3)| estimate | lower | upper | comparison |
|---|---|---|---|
| -0.99 | -2.598 | 0.618 | middepth-bottom |
| -1.84 | -3.268 | -0.412 | surface-bottom |
| -0.85 | -1.923 | 0.223 | surface-middepth |
Comparing Aldrin concentrations
| estimate | lower | upper | comparison |
|---|---|---|---|
| -0.99 | -2.598 | 0.618 | middepth-bottom |
| -1.84 | -3.268 | -0.412 | surface-bottom |
| -0.85 | -1.923 | 0.223 | surface-middepth |
Based on this, we see there is a statistically significant difference between the mean aldrin concentration at the surface and at the bottom.
Comparing Aldrin concentrations
| estimate | lower | upper | comparison |
|---|---|---|---|
| -0.99 | -2.598 | 0.618 | middepth-bottom |
| -1.84 | -3.268 | -0.412 | surface-bottom |
| -0.85 | -1.923 | 0.223 | surface-middepth |
Based on this, we see there is a statistically significant difference between the mean aldrin concentration at the surface and at the bottom. More specifically, we are 98.3% confident that the mean aldrin level is about 0.412 to 3.268 nanograms per liter lower at the surface than at the bottom.
Recap
Next steps after ANOVA
Individual vs. family-wise Type I error
Multiple comparisons using Bonferroni correction
