Timeline
Topic ideas due Sun,Mar 7 at 11:59p EST
Proposal due Mon, Mar 29 at 11:59p EST
Draft report due Sun, Apr 18 at 11:59p EDT
Peer review due Mon, Apr 19 at 11:59p EDT
Final report due Mon, Apr 26 at 11:59p EDT
Video presentation + slides due Thu, Apr 29 at 11:59p EDT
Presentation comments due Sat, May 01 at 11:59p EDT
Introduction
TL;DR: Pick a data set and do a regression analysis. That is your final project.
The goal of the final project is for you to use regression analysis to analyze a data set of your own choosing. The data set may already exist or you may collect your own data by scraping the web.
Choose the data based on your group’s interests or work you all have done in other courses or research projects. The goal of this project is for you to demonstrate proficiency in the techniques we have covered in this class (and beyond, if you like!) and apply them to a data set to analyze it in a meaningful way.
All analyses must be done in RStudio, and all components of the project must be reproducible (with the exception of the presentation).
Logistics
You will work on the project with your lab groups.
The four primary deliverables for the final project are
- A written, reproducible report detailing your analysis
- A GitHub repository corresponding to your report
- Slides + a video presentation
- Formal peer review on another team’s project
Topic ideas
Identify 2-3 data sets you’re interested in potentially using for the final project. If you’re unsure where to find data, you can use the list of potential data sources in the Tips + Resources section as a starting point. It may also help to think of topics you’re interested in investigating and find data sets on those topics.
The purpose of submitting project ideas is to give you time to find data for the project and to make sure you have a data set that can help you be successful in the project. Therefore, you must use one of the data sets submitted as a topic idea, unless otherwise notified by the teaching team.
The data sets should meet the following criteria:
- At least 100 observations
- At least 10 columns
- At least 6 of the columns must be useful and unique predictor variables.
- Identifier variables such as “name”, “social security number”, etc. are not useful predictor variables.
- If you have multiple columns with the same information (e.g. “state abbreviation” and “state name”), then they are not unique predictors.
- At least one variable that can be identified as a reasonable response variable.
- The response variable can be quantitative or categorical.
- A mix of quantitative and categorical variables that can be used as predictors.
- Observations should reasonably meet the independence condition. Therefore, avoid data with repeated measures, data collected over time, etc.
- You cannot use data that has previously been used in any course materials, or any derivation of data that has been used in course materials.
Please ask a member of the teaching team if you’re unsure whether your data set meets the criteria.
Submission
You will submit the topic ideas in the 01-topic-ideas folder in the project repo on GitHub. The submission should include the following for each data set:
- Short description of the data (1 - 2 sentences).
- Description of the variables or link to data dictionary.
glimpseof data set
Submit your work by pushing it to your GitHub repo by the deadline. The teaching team will submit feedback about your topic ideas using the Issues on GitHub.
Project proposal
The purpose of the project proposal is to help you think about your analysis strategy early. s
Include the following in the proposal:
Section 1 - Introduction
The introduction section includes
- an introduction to the subject matter you’re investigating
- the motivation for your research question (citing any relevant literature)
- the general research question you wish to explore
- your hypotheses regarding the research question of interest.
Section 2 - Data description
In this section, you will describe the data set you wish to explore. This includes
- description of the observations in the data set,
- description of how the data was originally collected (not how you found the data but how the original curator of the data collected it).
Section 3 - Analysis approach
In this section, you will provide a brief overview of your analysis approach. This includes:
- Description of the response variable.
- Visualization and summary statistics for the response variable.
- List of variables that will be considered as predictors
- Regression model technique (multiple linear regression and logistic regression)
Data dictionary (aka code book)
Submit a data dictionary for all the variables in your data set in the README of your project repo.
Submission
Submit your work by pushing it to your GitHub repo by the deadline. The teaching team will submit feedback about your proposal using the Issues on GitHub.
Proposal grading
| Total | 10 pts |
|---|---|
| Introduction | 3 pts |
| Data description | 2 pts |
| Analysis plan | 4 pts |
| Data dictionary | 1 pts |
Each component will be graded as follows:
-
Meets expectations (full credit): All required elements are completed and are accurate. The narrative is written clearly, all tables and visualizations are nicely formatted, and the work would be presentable in a professional setting.
-
Close to expectations (half credit): There are some elements missing and/or inaccurate. There are some issues with formatting.
-
Does not meet expectations (no credit): Major elements missing. Work is not neatly formatted and would not be presentable in a professional setting.
Draft report
The purpose of the draft and peer review is to give you an opportunity to get early feedback on your analysis. Therefore, the draft and peer review will focus primarily on the exploratory data analysis and modeling. As you work on the draft, the focus should be on the analysis rather than crafting the final report.
Write the draft in the written-report.Rmd file in your project repo. Below is a brief description of the sections to focus on in the draft:
Introduction and data
This section includes an introduction to the project motivation, data, and research question. Describe the data and definitions of key variables. It should also include some exploratory data analysis. All of the EDA won’t fit in the paper, so focus on the EDA for the response variable and a few other interesting variables and relationships.
Methodology
This section includes a brief description of your modeling process. Explain the reasoning for the type of model you’re fitting, predictor variables considered for the model including any interactions. Additionally, show how you arrived at the final model by describing the model selection process, any variable transformations (if needed), and any other relevant considerations that were part of the model fitting process.
For the draft, you may show the results from a few models you’ve considered.
Results
This is also where you will output the final model and include a brief discussion of the model assumptions, diagnostics, and any relevant model fit statistics.
For the draft, if you do not have a final model, briefly describe your next steps and other models you’re considering.
Peer review
Critically reviewing others’ work is a crucial part of the scientific process, and STA 210 is no exception. Each lab team will be assigned another team’s project to review. Each team should push their draft to their GitHub repo by Sunday, April 18. The lab on April 19 will be dedicated to the peer review, and all reviews will be due by Monday, April 19.
During the peer review process, you will be provided read-only access to your partner team’s GitHub repo. Provide your review in the form of GitHub issues to your partner team’s GitHub repo. The peer review will be graded on the extent to which it comprehensively and constructively addresses the components of the partner team’s report: the research context and motivation, exploratory data analysis, and any inference, modeling, or conclusions.
Written report
Your written report must be completed in the written-report.Rmd file and must be reproducible. All team members should contribute to the GitHub repository, with regular meaningful commits.
Before you finalize your write up, make sure the printing of code chunks is off with the option echo = FALSE.
You will submit the PDF of your final report on Gradescope.
The PDF you submit must match the files in your GitHub repository exactly. The mandatory components of the report are below. You are free to add additional sections as necessary. The report, including visualizations, should be no more than 10 pages long. There is no minimum page requirement; however, you should comprehensively address all of the aspects mentioned below.
Please be selective in what you include in your final write-up. The goal is to write a cohesive narrative rather than explain every step of the analysis.
The written report is worth 40 points, broken down as follows
| Total | 40 pts |
|---|---|
| Introduction/data | 8 pts |
| Methodology | 9 pts |
| Results | 14 pts |
| Discussion + Conclusion | 5 pts |
| Organization + formatting | 4 pts |
Each item will be graded as one of the following:
- Full credit: The item is complete and accurate.
- Half credit: The item is partially incomplete and/or there are minor inaccuracies.
- No credit: The item is mostly incomplete and/or there are major inaccuracies.
Introduction and data
This section includes an introduction to the project motivation, data, and research question. The data and definitions of key variables are described. It should also include some exploratory data analysis (EDA) - visualizations and appropriate summary statistics. All of the EDA won’t fit in the paper, so focus on the EDA for the response variable and other key variables and multivariate relationships.
Grading criteria
(8 pts) The research question and motivation are clearly stated in the introduction, including citations for any external research. The data are clearly described, including a description about how the data were originally collected and a concise definition of the relevant variables for the analysis. The explanatory data analysis helps the reader better understand the observations in the data set and interesting relationships between the variables. It incorporates appropriate visualizations and summary statistics.
Methodology
This section includes a brief description of your modeling process. Explain the reasoning for the type of model you’re fitting, predictor variables considered for the model and any interactions. Additionally, discuss how you arrived at the final model by describing the model selection process, any variable transformations (if needed), and any other relevant considerations that were part of the model fitting process.
Grading criteria
(9 pts) The analysis steps are appropriate for the data and research question. The group used a thoughtful approach to select the final model that took into account potential interaction effects and addressed violations in model conditions. The model conditions and diagnostics are thoroughly and accurately assessed as appropriate for the model. If violations of model conditions still exist, there was a reasonable attempt to address them, i.e. based on what we’ve learned this semester.
Results
This is where you will output the final model with any relevant model fit statistics.
Describe the key results from the model. The goal is not to interpret every single variable in the model but rather to show that you are proficient in using the model output to address the research questions, using the interpretations to support your conclusions. Focus on the variables that help you answer the research question and that provide relevant context for the reader.
Grading criteria
(14 pts) The model fit is clearly assessed, and interesting findings from the model are clearly described. Interpretations of model coefficients are used to support the key findings and conclusions, rather than merely listing the interpretation of every model coefficient. If the primary modeling objective is prediction, the model’s predictive power is assessed.
Discussion + Conclusion
In this section you’ll include a summary of what you have learned about your research question along with statistical arguments supporting your conclusions. In addition, discuss the limitations of your analysis and provide suggestions on ways the analysis could be improved. Issues pertaining to the reliability and validity of your data and appropriateness of the statistical analysis should also be discussed here.
Grading criteria
(5 pts) Overall conclusions from analysis are clearly described. The group has thoughtfully considered potential limitations of their data and/or analysis and presented potential ideas to address these limitations and avenues to explore in future work.
Organization + formatting
This is an assessment of the overall presentation and formatting of the written report.
Grading criteria
(4 pts) The written report is neatly organized with clear section headers and appropriately sized figures with informative labels. Numerical results are displayed with a reasonable number of digits, and all visualizations are neatly formatted. All code, warnings, and messages are suppressed. Overall, the document would be presentable in a business or research setting.
Video presentation + slides
Slides
In addition to the written report, your team will also create presentation slides that summarize and showcase your project. Introduce your research question and data set, showcase visualizations, and discuss the primary conclusions. These slides should serve as a brief visual addition to your written report and will be graded for content and quality.
For submission, convert these slides to a .pdf document, and submit the PDF of the slides on Gradescope.
The slide deck should have no more than 6 content slides + 1 title slide. Here is a suggested outline as you think through the slides; you do not have to use this exact format for the 6 slides.
- Title Slide
- Slide 1: Introduce the topic and motivation
- Slide 2: Introduce the data
- Slide 3: Highlights from EDA
- Slide 4: Final model
- Slide 5: Interesting findings from the model
- Slide 6: Conclusions + future work
Video presentation
For the video presentation, you can speak over your slide deck, similar to the lecture content videos. The video presentation must be no longer than 10 minutes. It is fine if the video is shorter than 10 minutes, but it cannot exceed 10 minutes. You may use can use any platform that works best for your group to record your presentation. Below are a few resources on recording videos:
- Recording presentations in Zoom
- Apple Quicktime for screen recording
- Windows 10 built-in screen recording functionality
- Kap for screen recording
Once your video is ready, upload the video to Warpwire, then embed the video in a new discussion for the group.
To upload your video to Warpwire:
- Click the Warpwire tab in the course Sakai site.
- Click the “+” and select “Upload files”.
- Locate the video on your computer and click to upload.
- Once you’ve uploaded the video to Warpwire, click to share the video and make a copy of the video’s URL. You will need this when you post the video in the discussion forum.
To post the video to the discussion forum
- Click the Presentations tab in the course Sakai site.
- Click the Presentations topic.
- Click “Start a new conversation”.
- Make the title “Your Team Name: Project Title”. For example, “Teaching Team: Analysis of Cars in the US”.
- Click the Warpwire icon (between the flag and shopping cart icons).
- Select your video, then click “Insert 1 item.” This will embed your video in the conversation.
- Under the video, paste the URL to your video.
- You’re done!
You can see the Teaching team example in Sakai.
Presentation comments
Each student will be assigned 1 presentations to watch. Click here to see your viewing assignments.
Watch the group’s video, then click “Reply” to post a question for the group. You may not post a question that’s already been asked on the discussion thread. Additionally, the question should be (i) substantive (i.e. it shouldn’t be “Why did you use a bar plot instead of a pie chart”?), (ii) demonstrate your understanding of the content from the course, and (iii) relevant to that group’s specific presentation, i.e demonstrating that you’ve watched the presentation.
You may start posting questions and comments on Fri, Apr 30 12a EDT. All questions must be posted by Sat, May 01 at 11:59p ESDT.
This portion of the project will be assessed individually.
Reproducibilty + organization
All written work (with exception of presentation slides) should be reproducible, and the GitHub repo should be neatly organized.
The GitHub repo should include the following:
README: Short project description and data dictionary/data/*: Data set in the/datafolder./topic-ideas: Potential topics and data sets from earlier in the semester/proposal: Proposal from earlier in the semester/written-report: Written report/presentation: Presentation slides
Style and format does count for this assignment, so please take the time to make sure everything looks good and your data and code are properly formatted.
Peer teamwork evaluation
You will be asked to fill out a survey where you rate the contribution and teamwork of each team member by assigning a contribution percentage for each team member. Filling out the survey is a prerequisite for getting credit on the team member evaluation. If you are suggesting that an individual did less than half the expected contribution given your team size (e.g., for a team of four students, if a student contributed less than 12.5% of the total effort), please provide some explanation. If any individual gets an average peer score indicating that this was the case, their grade will be assessed accordingly.
Overall grading
The grade breakdown is as follows:
| Total | 105 pts |
|---|---|
| Topic ideas | 5 pts |
| Project proposal | 10 pts |
| Peer review | 10 pts |
| Written report | 40 pts |
| Slides + video presentation | 25 pts |
| Reproducibility + organization | 5 pts |
| Video comments | 5 pts |
| Peer teamwork evaluation | 5 pts |
Note: No late project reports or videos are accepted.
Grading summary
Grading of the project will take into account the following:
- Content - What is the quality of research and/or policy question and relevancy of data to those questions?
- Correctness - Are statistical procedures carried out and explained correctly?
- Writing and Presentation - What is the quality of the statistical presentation, writing, and explanations?
- Creativity and Critical Thought - Is the project carefully thought out? Are the limitations carefully considered? Does it appear that time and effort went into the planning and implementation of the project?
A general breakdown of scoring is as follows:
- 90%-100%: Outstanding effort. Student understands how to apply all statistical concepts, can put the results into a cogent argument, can identify weaknesses in the argument, and can clearly communicate the results to others.
- 80%-89%: Good effort. Student understands most of the concepts, puts together an adequate argument, identifies some weaknesses of their argument, and communicates most results clearly to others.
- 70%-79%: Passing effort. Student has misunderstanding of concepts in several areas, has some trouble putting results together in a cogent argument, and communication of results is sometimes unclear.
- 60%-69%: Struggling effort. Student is making some effort, but has misunderstanding of many concepts and is unable to put together a cogent argument. Communication of results is unclear.
- Below 60%: Student is not making a sufficient effort.
Late work policy
There is no late work accepted on this project. Be sure to turn in your work early to avoid any technological mishaps.
Tips + Resources
Data sources
Some resources that may be helpful as you find data:
Other data repositories
- World Health Organization
- The National Bureau of Economic Research
- International Monetary Fund
- General Social Survey
- United Nations Data
- United Nations Statistics Division
- U.K. Data
- U.S. Data
- U.S. Census Data
- European Statistics
- Statistics Canada
- Pew Research
- UNICEF
- CDC
- World Bank
- Election Studies
Tips
-
Ask questions if any of the expectations are unclear.
-
Code: In your write up your code should be hidden (
echo = FALSE) so that your document is neat and easy to read. However your document should include all your code such that if I re-knit your Rmd file I should be able to obtain the results you presented.- Exception: If you want to highlight something specific about a piece of code, you’re welcome to show that portion.
-
Merge conflicts will happen, issues will arise, and that’s fine! Commit and push often, and ask questions when stuck.
-
Make sure each team member is contributing, both in terms of quality and quantity of contribution (we will be reviewing commits from different team members).
-
All team members are expected to contribute equally to the completion of this assignment and group assessments will be given at its completion - anyone judged to not have sufficient contributed to the final product will have their grade penalized. While different teams members may have different backgrounds and abilities, it is the responsibility of every team member to understand how and why all code and approaches in the assignment works.
Formatting + communication
Suppress Code, Warnings, & Messages
- Include the following code in a code chunk at the top of your .Rmd file to suppress all code, warnings, and other messages. Use the code chunk header
{r set-up, include = FALSE}to suppress this set up code.
knitr::opts_chunk$set(echo = FALSE,
                      warning = FALSE,
                      message = FALSE)
Headers
- Use headers to clearly label each section. Make sure there is a space between the last
#and the title, so the header renders correctly. For example,###Section Titlewill not render as header, but### Section Titlewill.
References
- Include all references in a section called “References” at the end of the report.
- This course does not have specific requirements for formatting citations and references.
- See Section 4.5 of the R Markdown Cookbook to learn about the citation functionality in R Markdown.
Appendix
- If you have additional work that does not fit or does not belong in the body of the report, you may put it at the end of the document in section called “Appendix”.
- The items in the appendix should be properly labeled.
- The appendix should only be for additional material. The reader should be able to fully understand your report without viewing content in the appendix.
Resize figures
- Resize plots and figures, so you have more space for the narrative.
- Resize individual figures: Use the code chunk header
{r plot1, fig.height = 3, fig.width = 5}, replacingplot1with a meaningful label and the height and width with values appropriate for your write up. - Resize all figures: Include the
fig_widthandfig_heightoptions in your YAML header as shown below:
- Resize individual figures: Use the code chunk header
---
title: "Your Title"
author: "Team Name + Group Members"
output:
  pdf_document:
    fig_width: 5
    fig_height: 3
---
Replace the height and width values with values appropriate for your write up.
Arranging plots
Arrange plots in a grid, instead of one after the other. This is especially useful when displaying plots for exploratory data analysis and to check assumptions.
-
If you’re using ggplot2 functions, the
patchworkpackage makes it easy to arrange plots in a grid. See the documentation and examples here. -
If you’re using base R function, i.e. when using the
emplogitfunctions, put the codepar(mfrow = c(rows,columns))before the code to make the plots. For example,par(mfrow = c(2,3))will arrange plots in a grid with 2 rows and 3 columns.
Plot titles and axis labels
Be sure all plot titles and axis labels are visible and easy to read.
- Use informative titles, not variable names, for titles and axis labels.
- Use
coord_flip()to flip the x and y axes on the plot. This is useful if you a bar plot with an x-axis that is difficult to read due to overlapping text.
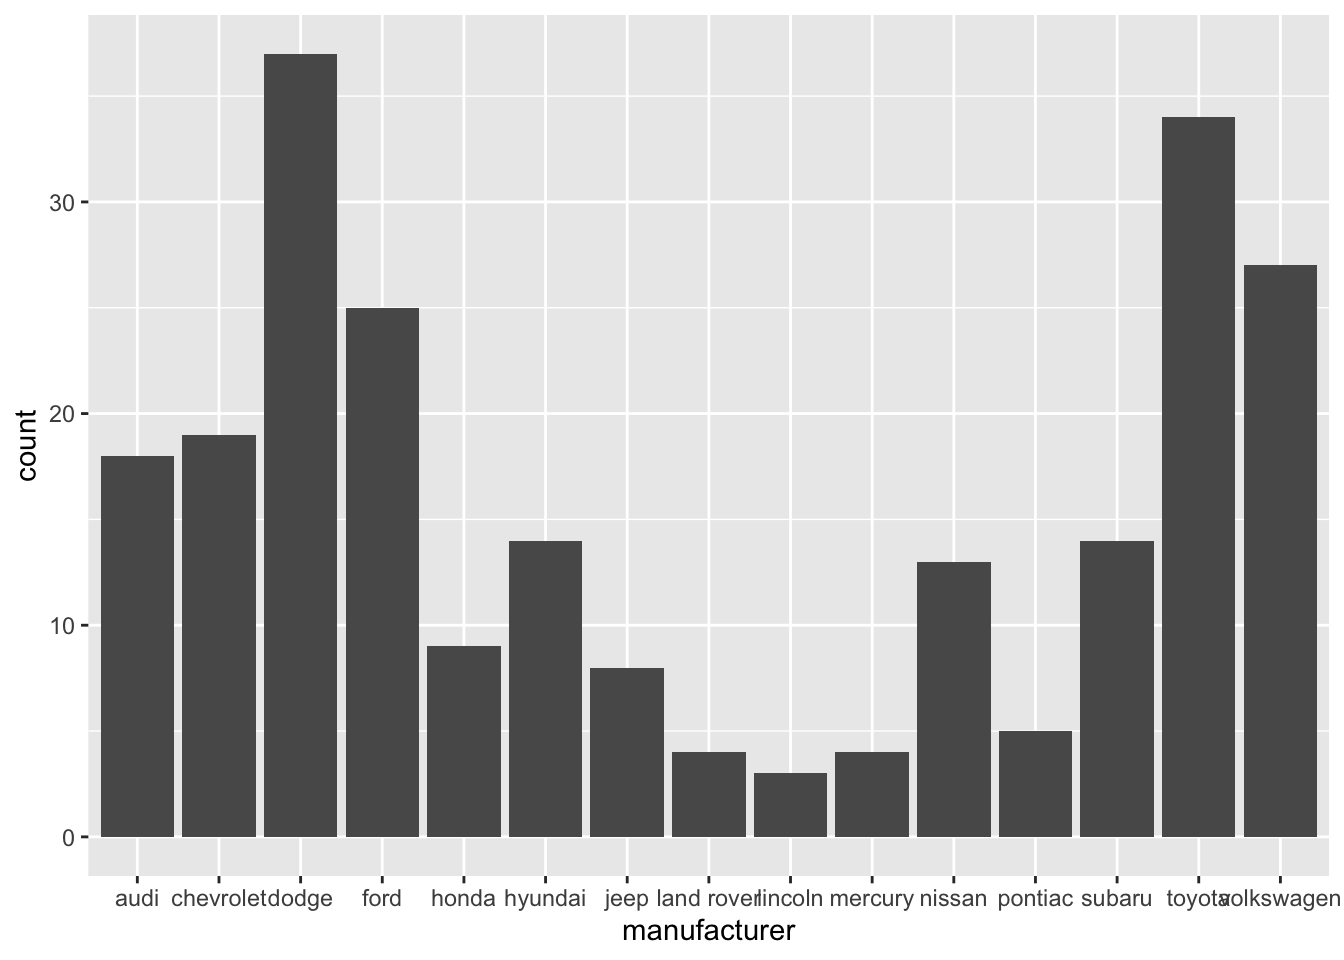
❌ NO! The x-axis is hard to read because the names overlap.
ggplot(data = mpg, aes(x = manufacturer)) +
  geom_bar()
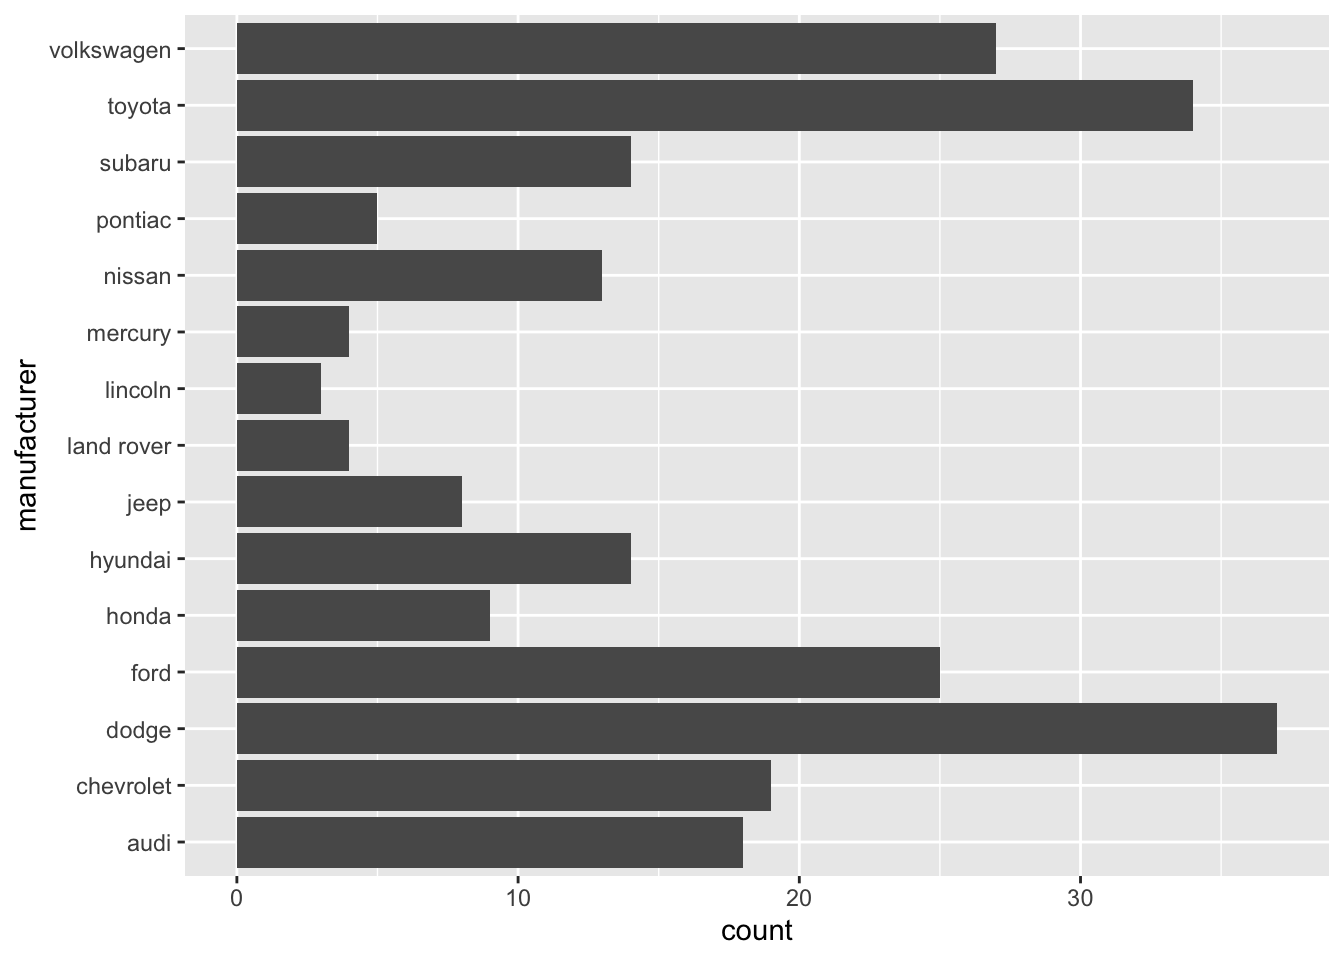
✅ YES! Names are readable
ggplot(data = mpg, aes(x = manufacturer)) +
  geom_bar() +
  coord_flip()
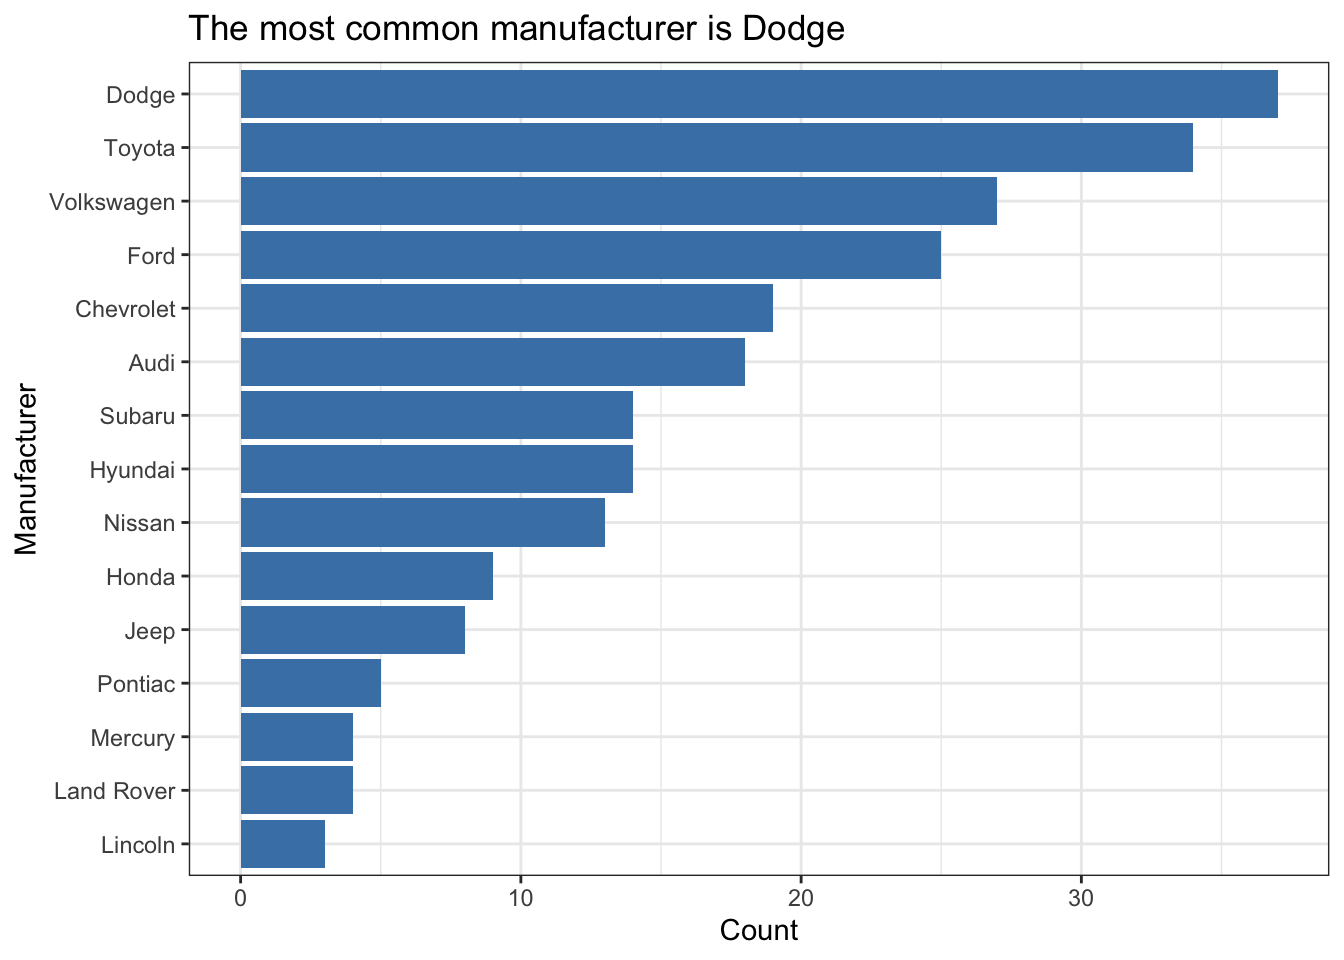
Do a little more to make the plot look professional!
- Informative title and axis labels
- Flipped coordinates to make names readable
- Arranged bars based on count
- Capitalized manufacturer names
- Optional: Added color - Use a coordinated color scheme throughout paper / presentation
- Optional: Applied a theme - Use same theme throughout paper / presentation
mpg %>%
  count(manufacturer) %>%
  mutate(manufacturer = str_to_title(manufacturer)) %>%
  ggplot(aes(x = fct_reorder(manufacturer,n), y = n)) +
  geom_bar(stat = "identity", fill = "steelblue") +
  coord_flip() +
  labs(x = "Manufacturer",
       y = "Count",
       title = "The most common manufacturer is Dodge") +
  theme_bw()
Tables and model output
- Use the
kablefunction from the knitr package to neatly output all tables and model output. This will also ensure all model coefficients are displayed.- Use the
digitsargument to display only 3 or 4 significant digits. - Use the
captionargument to add captions to your table.
- Use the
model <- lm(mpg ~ hp, data = mtcars)
tidy(model) %>%
  kable(digits = 3)
| term | estimate | std.error | statistic | p.value |
|---|---|---|---|---|
| (Intercept) | 30.099 | 1.634 | 18.421 | 0 |
| hp | -0.068 | 0.010 | -6.742 | 0 |
Guidelines for communicating results
- Don’t use variable names in your narrative! Use descriptive terms, so the reader understands your narrative without relying on the data dictionary.
- ❌ There is a negative linear relationship between mpg and hp.
- ✅ There is a negative linear relationship between a car’s fuel economy (in miles per gallon) and its horsepower.
- Know your audience: Your report should be written for a general audience who has an understanding of statistics at the level of STA 210.
- Avoid subject matter jargon: Don’t assume the audience knows all of the specific terminology related to your subject area. If you must use jargon, include a brief definition the first time you introduce a term.
- Tell the “so what”: Your report and presentation should be more than a list of interpretations and technical definitions. Focus on what the results mean, i.e. what you want the audience to know about your topic after reading your report or viewing your presentation.
- ❌ For every one unit increase in horsepower, we expect the miles per gallon to decrease by 0.068 units, on average.
- ✅ If the priority is to have good fuel economy, then one should choose a car with lower horsepower. Based on our model, the fuel economy is expected to decrease, on average, by 0.68 miles per gallon for every 10 additional horsepower.
- Tell a story: All visualizations, tables, model output, and narrative should tell a cohesive story!
- Use one voice: Though multiple people are writing the report, it should read as if it’s from a single author. At least one team member should read through the report before submission to ensure it reads like a cohesive document.
